
Bitcoin Correlations:
Crypto Tethered to Stocks
Crypto Correlations…
Assets with high correlations to each other have prices that move in the same direction at the same time. Events that correlate to price movements of an asset may provide clues as to what influences its value. If assets have price correlations with each other, it may suggest their values are influenced by the same factors. Though varied in structure, different crypto assets generally have a high correlation with each other, and their prices tend to move in line with the first and largest crypto asset, bitcoin. Though bitcoin’s creator designed it to mimic gold, and some proponents refer to it as “digital gold”, crypto assets have a low correlation to gold prices. As its creator thought it was more like gold than stocks, it may be ironic that bitcoin currently has a higher correlation with the stock market than with gold.
Block Chop
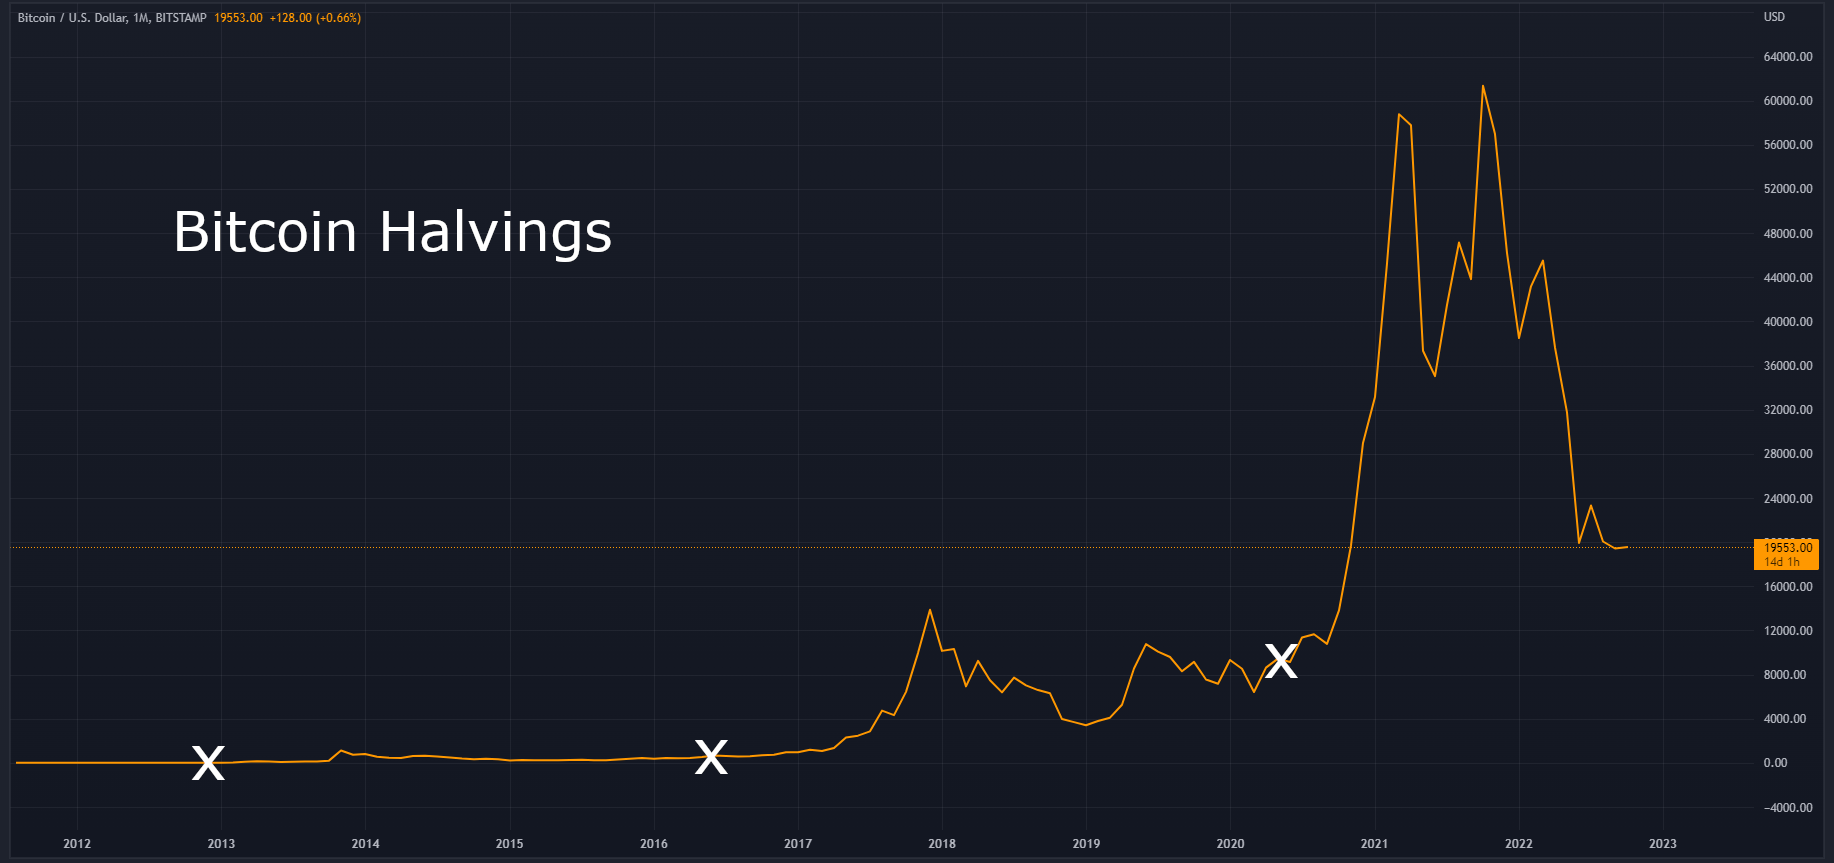
Bitcoin’s creator focused almost exclusively on scarcity as related to value, and programmed events called halvings to reduce the number of new bitcoins that can be created from mining. Some crypto proponents suggest halvings are correlated with bitcoin prices, causing them to rise. However, because the events happen once every four years, it only provides a small sample size. There have been just three halvings so far, which is a small number of observations to use when calculating correlation over ten years. Also, though halvings were followed by price increases, they did not happen at the same time as halvings. Additionally, the effect and timing of all halvings are predetermined, and their occurrence is not new information. Efficient markets only react to new information, as what is already known has already been priced in and accounted for by investors.

Inflation Conflation
Bitcoin and perhaps most other crypto assets were created to solve two problems - inflation and mistrust of the financial system. Born in the midst of the Great Recession and intended to exist outside of traditional financial systems of banks, central banks and capital markets, bitcoin emerged as an expression of angst towards Wall Street and the Federal Reserve. Distrust of finance and institutions and even conspiracy theory seems to permeate the early bitcoin chat forums where cryptographers discussed its beginnings. One member said bitcoin “makes it possible to secede from government”, while another said it can make “government and big business irrelevant and obsolete”. Yet another suggested Wikileaks was “run by the CIA”. One thread member called the stock market a “scam”, and some forum members, including bitcoin’s creator, did not think it was comparable to stocks. In light of the anti-market sentiment associated with bitcoin, it may be ironic that crypto has been following the same pattern as stock prices.

Tied to Stocks
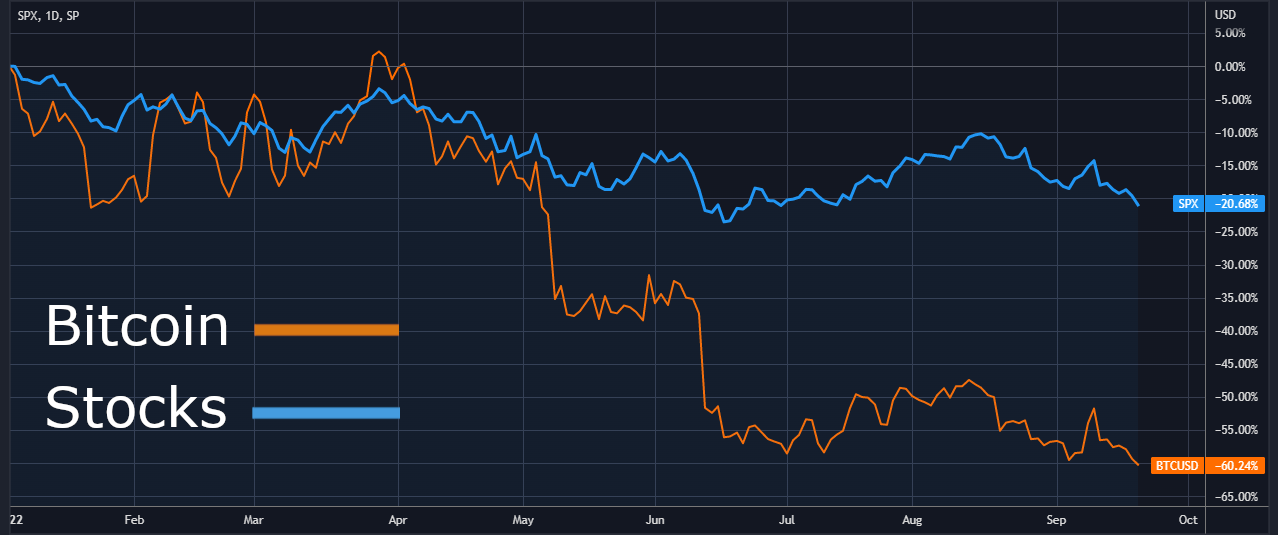
Chart B shows how the overall stock market and bitcoin prices have been moving together in the same direction at the same time. One difference between the two is their levels of volatility. Having lost around 60% of its value this year versus a loss of around 20% for stocks, bitcoin has been more volatile. Holding assets in a portfolio that are not correlated with each other can provide stabilization as some assets may rise while others fall. Though bitcoin has been described as a non-correlated asset, its increasing correlation with the stock market does not support it as a hedge against falling stock prices. Additionally, as bitcoin was designed in an attempt to end inflation, it may also be ironic that its current price plummet is not only happening along with stocks, but also during a period of rapidly rising inflation. Crypto has not been a hedge against loss of purchasing power during a time of pronounced inflation.
Risk Assets…
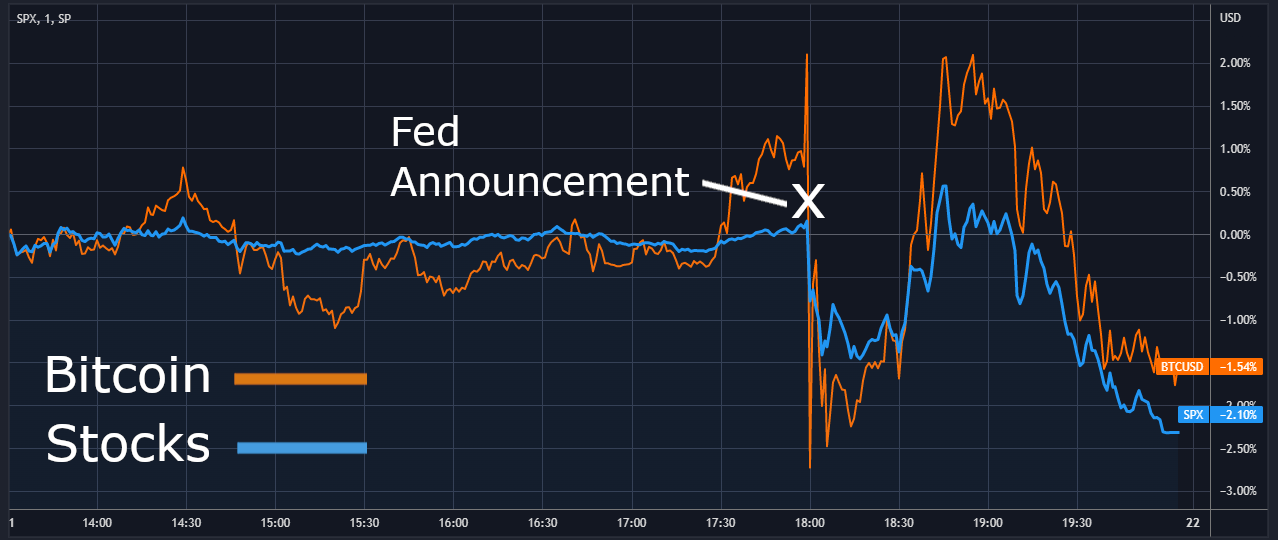
When considering why bitcoin is correlated with stocks, one possibility is that crypto is now considered a risk asset by its current market participants. Risk assets, like stocks, have prices that are sensitive to the overall economic outlook. Potentially once-in-a-generation moves by the Fed may be causing stock investors to reassess valuations. As the Fed wields a sledgehammer to smash demand, rising interest rates affect the fundamental value of companies, requiring an adjustment to the risk premium investors will want for holding the stock. Fed actions are one of the most significant events affecting the economy, and days they announce policy decisions produce some of the highest levels of volatility as investors react. In Chart C, the moment of the Fed announcement on Sep 21 at 2:00 EST is clearly evident, with bitcoin reacting at the same time and in the same direction as stock prices. With bitcoin reacting directly to action from the US central bank, it may be yet another irony related to its intended existence as removed from the influence of monetary policy.
October 19, 2022

Resources:
Bitcoin forum posts can be viewed at this link.
Price and correlation data from Blockchain Center, Coin Metrics, Cryptowatch, PortfoliosLab, TradingView.
Sources on Bitcoin Correlations:
Baur, D. G.; Dimpfl, T. & Kuck, K. (2018). Bitcoin, gold and the US dollar – A replication and extension. Finance Research Letters, Elsevier, vol. 25(C), p. 103-110.
Baur, D. G.; Hoang, L. (2021). The Bitcoin gold correlation puzzle. Journal of Behavioral and Experimental Finance. Volume 32.
Klein, T.; Thu, H. P. & Walther, T. (2018). Bitcoin is not the New Gold – A comparison of volatility, correlation, and portfolio performance. International Review of Financial Analysis, Volume 59, p. 105-116.
Manavi, S. A.; Jafari, G.; Rouhani, S.; & Ausloos, M. (2020). Demythifying the belief in cryptocurrencies decentralized aspects. A study of cryptocurrencies time cross-correlations with common currencies, commodities and financial indices. Physica A: Statistical Mechanics and its Applications. Volume 556, issue C.
Zhang, W.; Wang, P., Li, X.; & Shen, D. (2018). The inefficiency of cryptocurrency and its cross-correlation with Dow Jones Industrial Average. Physica A: Statistical Mechanics and its Applications, Volume 510, p. 658-670.
Markets Demystified is published the first and third Wednesdays of each month,
and explores how stock market investing can relate to personal finance.
Thanks for Reading!
Sincerely,
Jonathon Oden
Owner | Aesop Advisor LLC
Aesop Advisor LLC advertisements including newsletters and other publications are for informational purposes only. They do not attempt to predict future stock market moves and are not intended as individual investment advice. Aesop Advisor LLC newsletters and publications are not recommendations to buy, sell or hold any asset and are not intended as actionable investment advice or market timing. Equities references generally refer to the overall stock market, though if individual companies are mentioned, it is not a recommendation to buy, sell, or hold shares of the company. Unless otherwise indicated, terms including "stocks", the "stock market", and "market(s)" refer to Standard & Poor's 500 index. All investments involve risk and the past performance of a security or financial product does not guarantee future results or returns. While diversification may help spread risk, it does not assure a profit or protect against loss. There is always the potential of losing money when you invest in securities or other financial products. Publications and advertisements from Aesop Advisor LLC are not intended as investment, legal, or tax advice. Although gathered from sources believed to be reliable, Aesop Advisor LLC cannot guarantee the accuracy and completeness of data or information presented in publications and advertisements. This is an advertisement.